Data analysis · LLM reporting
DataBrief
Turn a raw dataset into a report that explains what stands out and the statistics behind it.
- Problem
- A spreadsheet can contain an unexpected pattern without making it obvious. The work is finding it, checking the evidence, and explaining it clearly.
- My role
- Built the application from upload and statistical analysis through LLM narration, report viewing, and document export.
- Stack
- Next.js · TypeScript statistics engine · Prisma / Neon Postgres · Inngest · LangChain.js / LangGraph.js
- Outcome
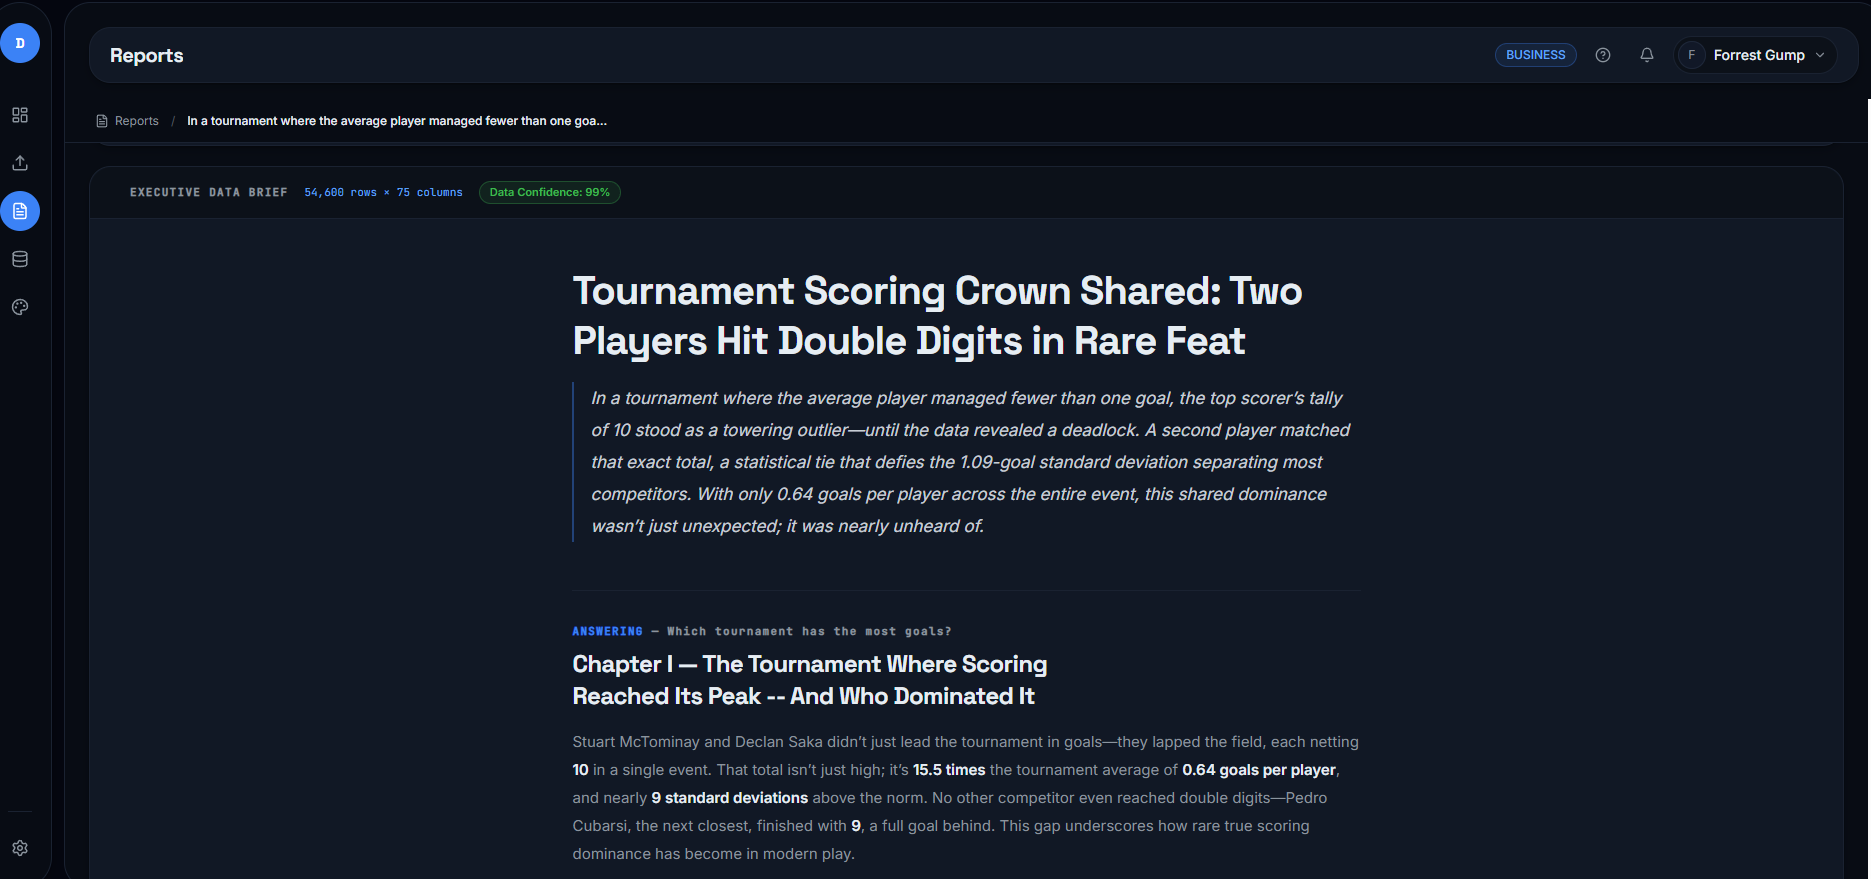
- A working report pipeline with an in-app reader and PDF, Word, and PowerPoint exports. The captured output below shows the narrative alongside its supporting statistics.
Finding
The report identifies a shared scoring lead: two players with 10 goals each.
Statistic
The captured report gives a mean of 0.64 goals and a standard deviation of 1.09, putting 10 goals roughly 8.6 standard deviations above the mean.
Interpretation
An unusual result is a prompt to investigate. Check dataset scope and player records before treating an outlier as evidence of performance.
Portfolio commentary, not a quoted report recommendation.
Inside the product
Usage dashboard
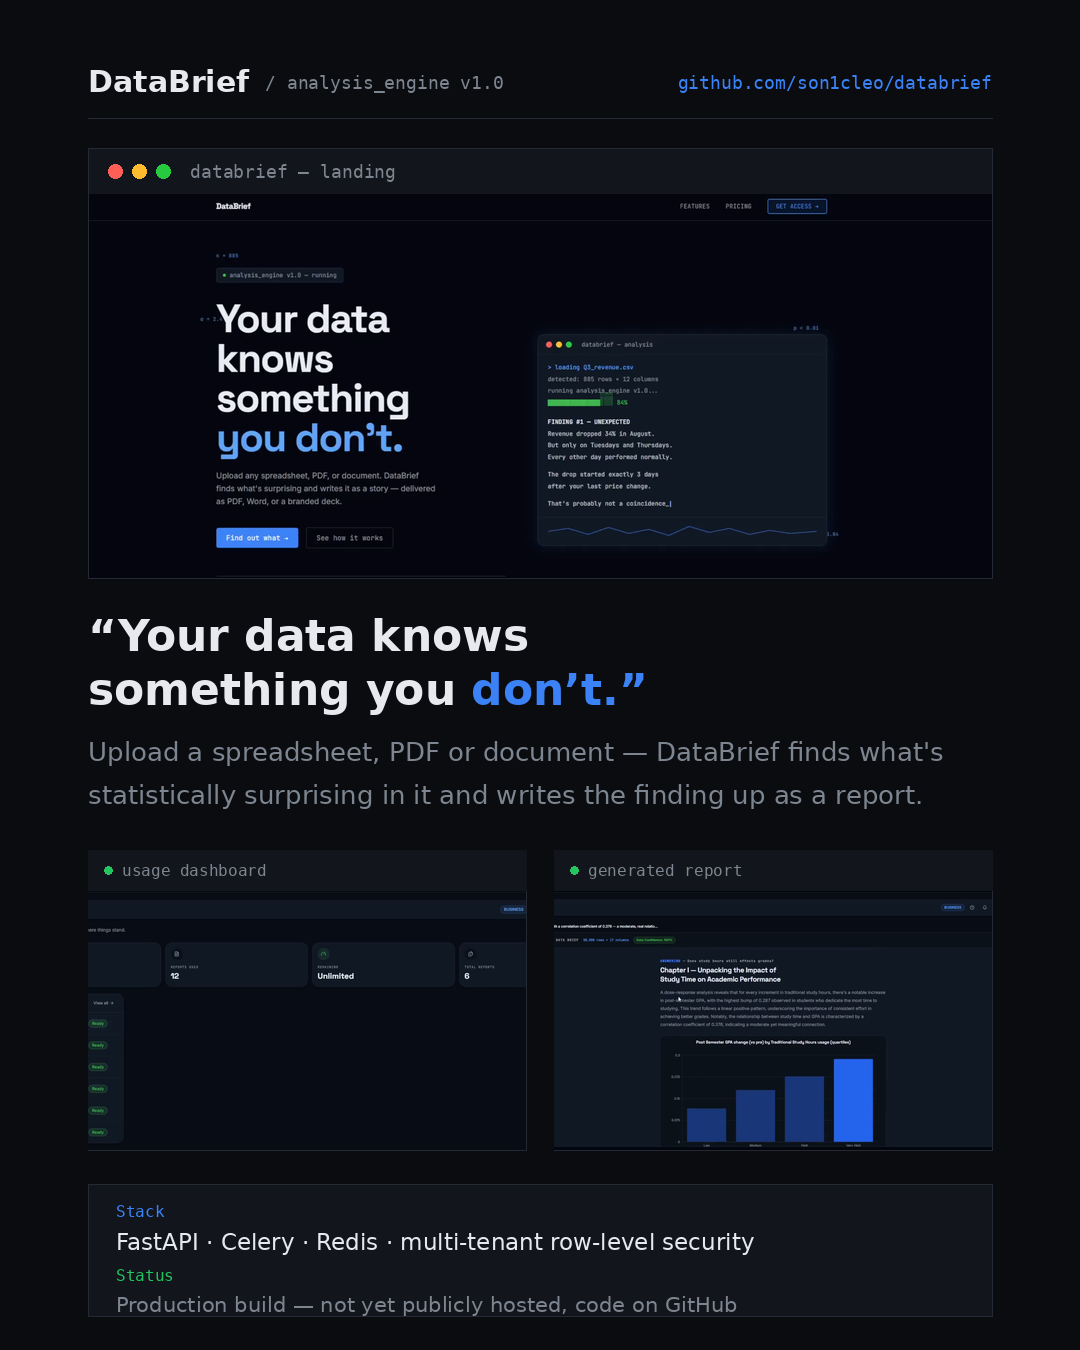
Report narrative and chart
Screenshot excerpts from the project overview.
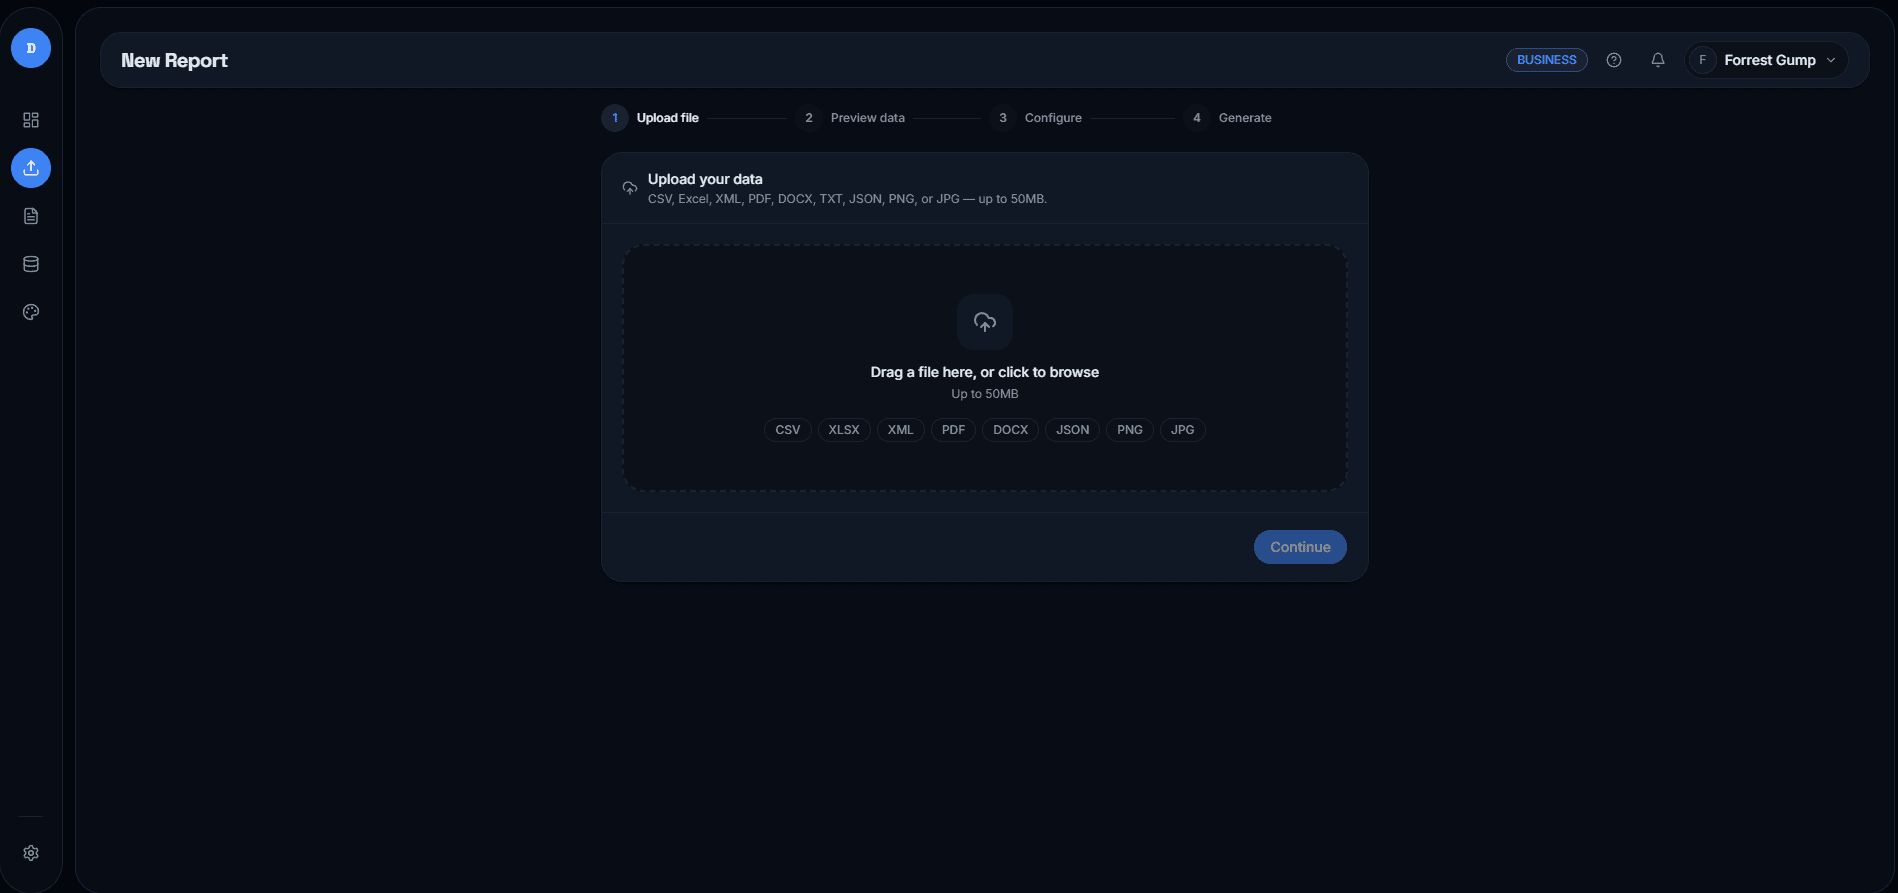
See the upload interface